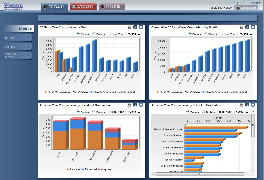
The Annual Fund Layer displays viewports containing information relevant to your Annual Fund Campaign. Users can customize their Dashboard, choosing from a catalog of viewports, by clicking the edit button in the upper right corner of each viewport. The viewports have several features to note:
- Viewport Toggle – This feature allows you to change the variable that is being graphed over the same period. A common example is selection of "dollars" or "donors".
- Fiscal Year – This feature allows you to change the fiscal year that is being displayed in the viewport. You are able to select up to the previous 5 fiscal years.
- Graph Dwell Reveal – This feature will provide you with the actual count within a section of a graph. This roll-over feature will disappear when you are no longer dwelling on the section.
- Drill Down – When you click on a column section, this feature will display the people who are related to that section. This table is column-sortable and exportable to Excel as a .csv file.
*Data displayed in each of the viewports is drawn from internal and external data sources.