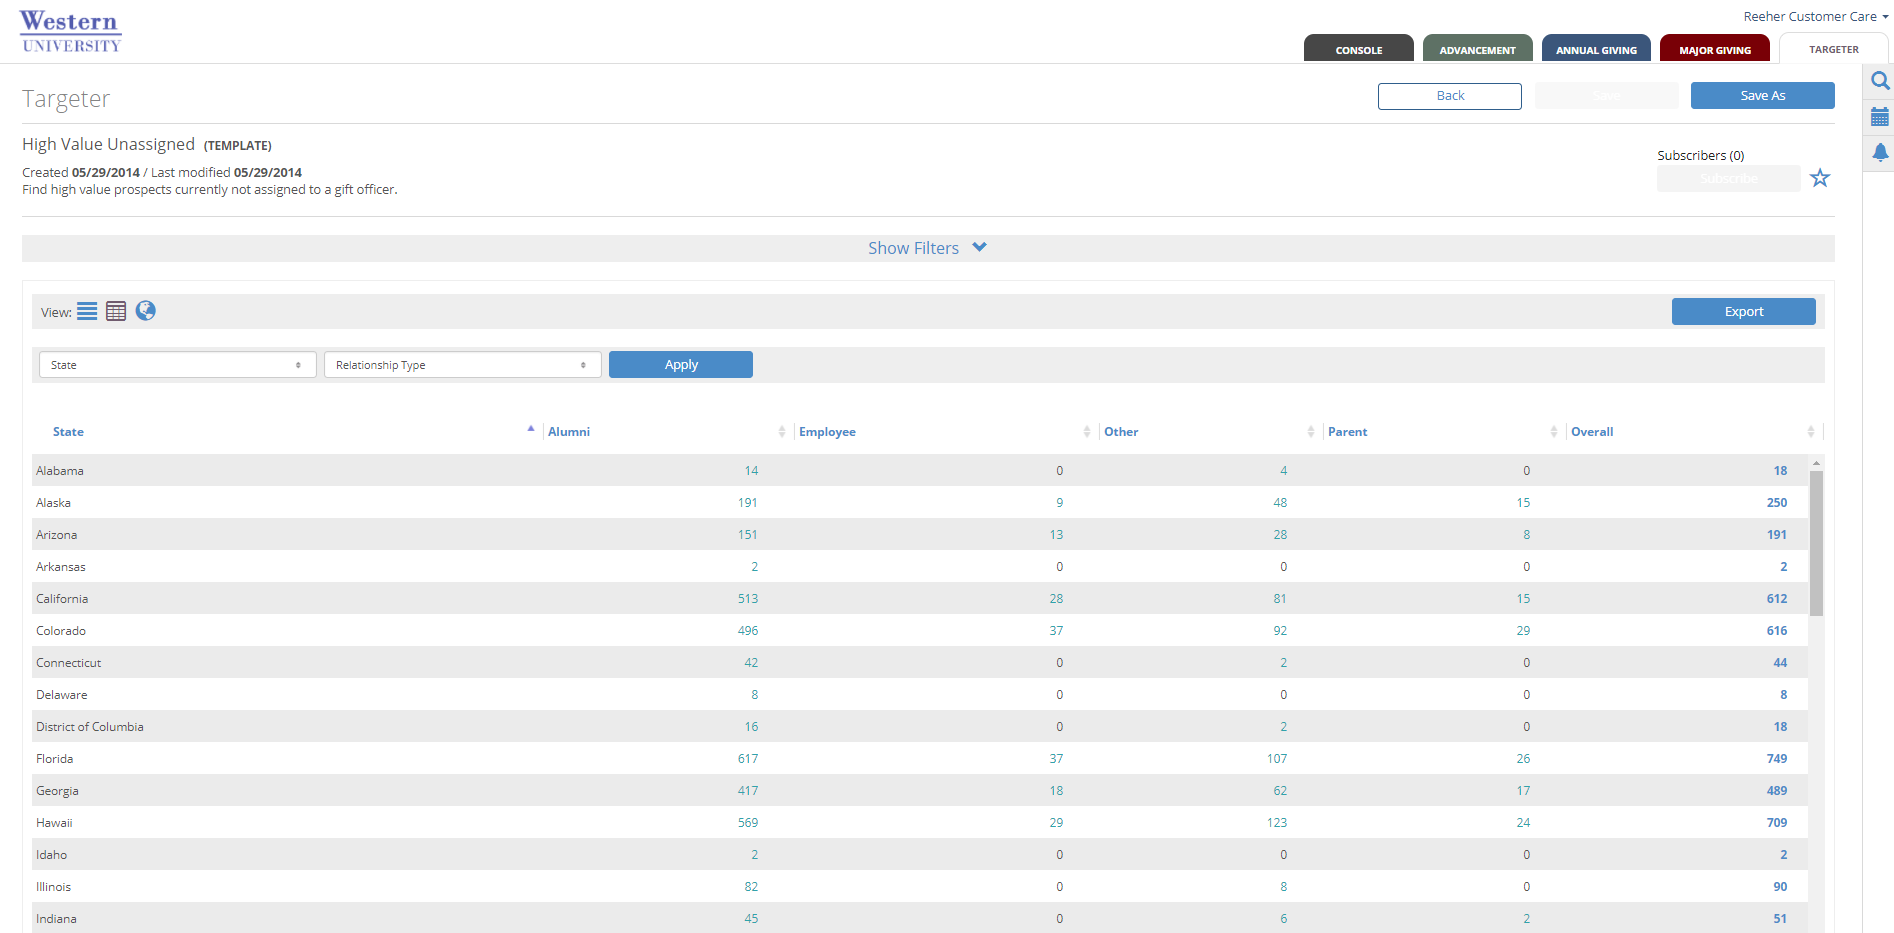
The Crosstab view provides users with a summary of the full query results spread out across two variables. This will allow you to analyze your results based on a distribution across the criteria you select.
To access Crosstab, click on the center grid icon at the top left of the results window after running your query. Here, you will see two pull down menus that correspond to the variables that will be applied to your results in the table below. To change your variables in Crosstab, select your criteria from the pull down menus above the results table. The menu on the left represents the vertical access and the menu on the right represents the horizontal. By selecting different data fields, you can view your results in a table that will give you a count on which constituents meet the two criteria. Then, when you click on the count in a column section, a list of the individuals who are related to that section of the table will be displayed.
You can also export the entire table by clicking on the Export Results button on the right side of the results window. Note that this will produce a spreadsheet of the table with the variable counts and does not contain the list of individual constituents.