Page History
The Map View can be used to display constituents geographically to prepare visual reports for management, target and plan officer travel, or strategize about alumni events. To access the Map View for your query results click on the globe icon to the right of the List View and Crosstab icons.
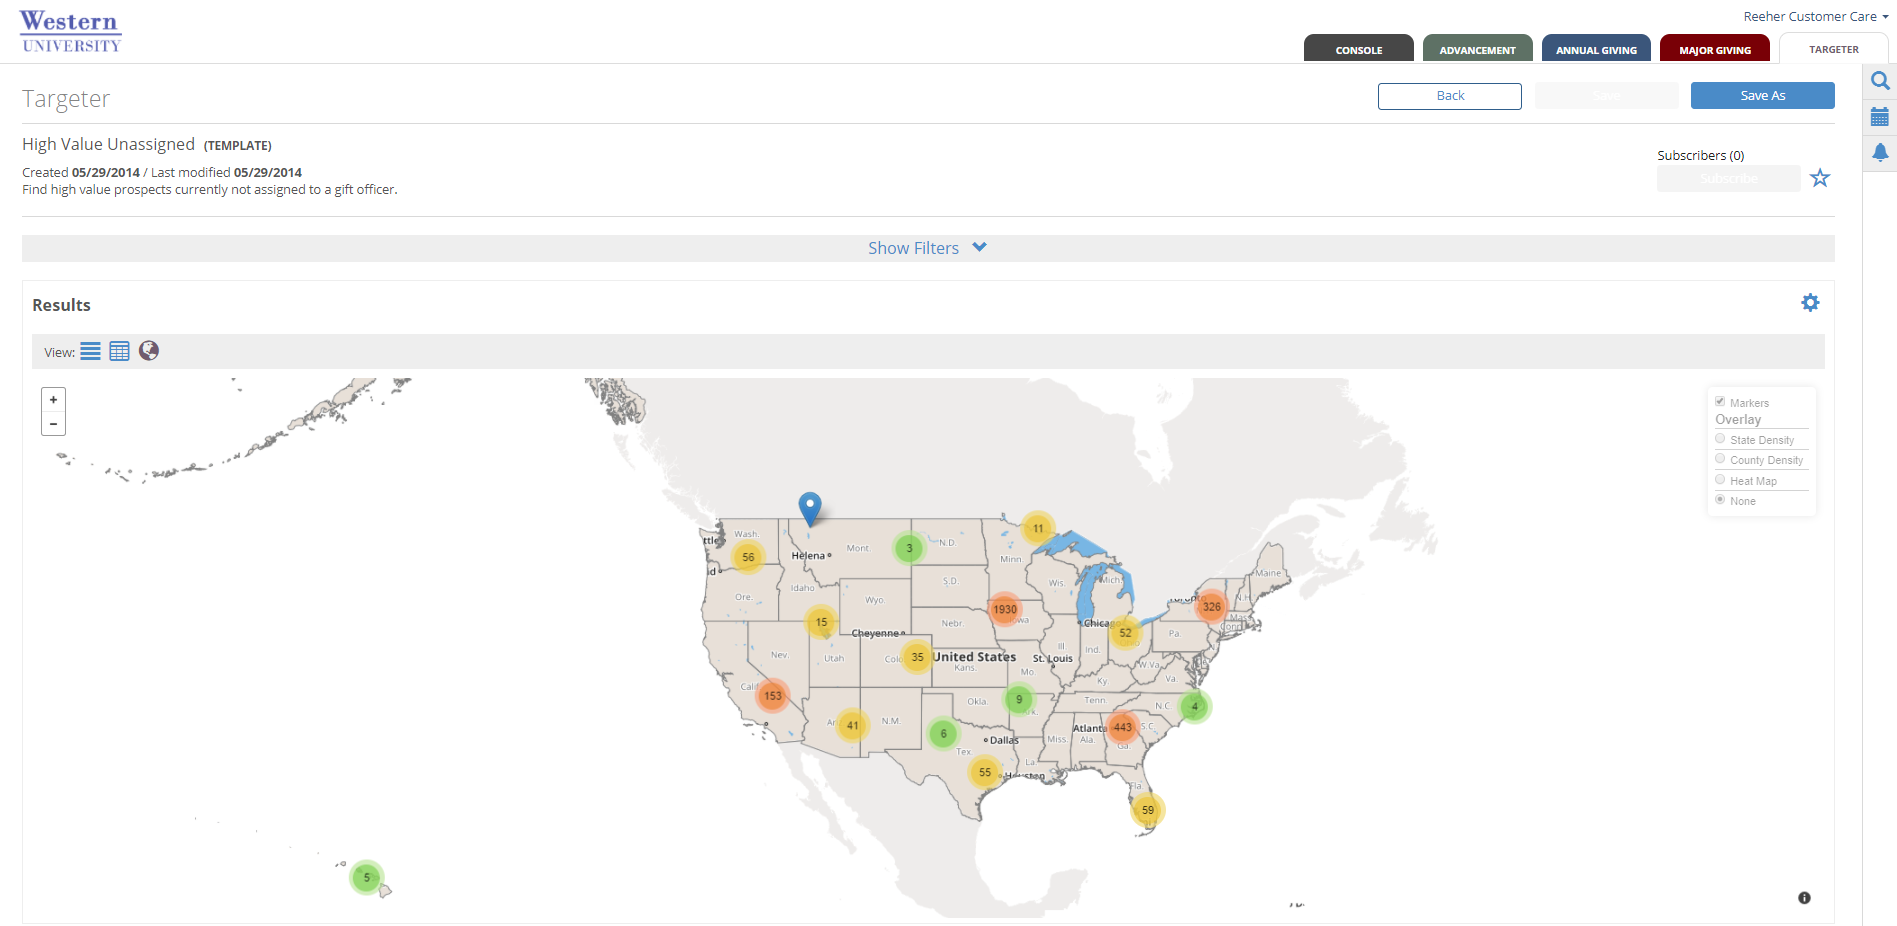
Click on this globe icon to plot your query results on a map—and choose between viewing the data with Markers, a Heat Map, or a Density Map using the selection box at the top right of the map.
- Markers - Grouped counts of constituents are displayed in colored circles. Hovering over each circle shows the area displays the area which is covered by that count. Zooming further into the map will give greater detail into each marked area. A blue pin on the map represents a constituent's home address. Clicking on a blue pin gives you information regarding the residents of that address and clicking on the name will show you the constituent's Relationship Profile.
- Heat Map - Shows detailed concentrations of constituents on the map. Darker colors represent a greater concentration of constituents. Note that the Heat Map is only available for results sets under 25,000 records.
- Density Map - Shows concentrations of constituents by state or county. You can view a legend of the color representations at the bottom right of the map.
Map View covers only the United States and allows you to drill down to the constituents Home Address. Note PO box addresses will not display on the map view.